Unit 1 Exam Revision
Seen Dot Points
Intro to Economics
Explain the concept of Economics
- Economics deals with two basic facts.
- People are faced with limited resources
- People have unlimited wants
- This is the Basic Economic Problem (BEP)
- The BEP is a problem of both Scarcity and choice
- To formalise, 'Economics is the study of how people allocate their limited resources to satisfy their unlimited wans - the study of the economic problem, which is one of scarcity and choice.' #testanswer
- To solve the BEP, three basic questions should be answered;
- What to produce?
- How to produce?
- For whom to produce?
- In doing so, economics is a social science
- Wants are unlimited, recurring, complimentary (iPhone -> Air pods), specific to a person, location and time, and have varying levels of importance
Scarcity
- Anything that has a price is scarce.
- Free goods are those that are not relatively scarce and do not have a price (for example, air breathed)
- It is important to not confuse scarcity with a shortage
- A shortage occurs when the supply of something is limited
- Scarcity is the fundamental issue of infinite wants
Choice
- Because of scarcity - because of the limited resources, we must choose between one option or the other
- For example, I have the limited amount of $15 - do i
- a) Go to the movies or
- b) Go to a restaurant?
- For example, I have the limited amount of $15 - do i
- Making choices when confronted by scarcity involves a trade-off
Distinguish between microeconomics and macroeconomics
- Macroeconomics deals with the economic problem from society's point of view
- It is concerned with the performance of the whole economy
- Microeconomics deals with economics from an individual point of view - referring to a small perspective
Describe the economic decision-making process
Discuss the importance of economic models
- A simplified representation of economic reality showing the relationship between certain economic variables
- Not inclusive of all detailed; simplified to show key correlations
- It is assumed that people have rational self-interest - that economic decisions are based on a person following a logical process
- Rationality is determined as benefit exceeding cost
- Price is useful for measuring both
Positive and Normative
- Beside developing models, developing theory is known as positive economics - 'what is' in the economy
- On the other hand, normative economics is the domain of 'what should be' - largely opinionated
- Normative statements involve a value judgement - an opinion that one situation is preferable above another
Demonstrate and explain the Production Possibility Frontier (PPF) Model
- Used to visualise the opportunity cost of producing one good/service over another. BEP is best demonstrated with a PPF. There are three main assumptions;
- Resources are fixed
- Technology is fixed
- Economy produces only 2 goods
- Each axis are goods
- Bowed out curve (realistic)
- Straight curve (constant opportunity cost)
- Inside curve - inefficient points
- Outside - unattainable points
- On curve - efficient and attainable
- Curve can shift if technology or resources change
Discuss the characteristics of a market economy
- Solves the BEP in a network of separate but interconnected markets
- Markets have;
- Buyers (create demand)
- Sellers (create supply)
- A commodity (that is bought or sold)
- Voluntary exchange (between buyers and sellers)
- A process, mechanics or arrangement through which buyers and sellers 'meet'
- Price (dependant on strength of demand and supply)
- Two types;
- Product markets:
- Demand is created by consumers or households
- Deal in the buying and selling of goods and services
- Supply is created by producers and firms
- Factor markets:
- Deal in the buying and selling of factors of production (Land, Labour, Capital, Enterprise)
- Demand created by firms
- Supply created by households
- Product markets:
Key features of a market economy
- Property rights and private ownership
- Economic freedom (able to choose one's own participation in the economy)
- Self-interest
- Competition
- Moral Hazards (there are consequences of poor decision making)
- Limited role of government (mainly regulatory)
Demand
Define the Law of Demand
- There is an inverse relationship between the price of a product and the quantity of the product demanded, due to; #testanswer
- Substitution effect - when a product increases in price, consumers substitute for a cheaper good
- Income effect - when a product becomes more expensive, it takes up a larger portion of a consumers' income and so the consumer has less to spend on other goods
- The purchasing power of income is reduced
Explain the relationship between individual and market demand schedules and curves
- The demand curve is downward sloping, labelled 'D'. X-axis is labelled as quantity, and the Y-axis as price.
- The individual demand curve is;
- The demand curve for an individual consumer
- The market demand curve is;
- The curve obtained from the horizontal summation of individual demand curves (i.e the average basically)
Demonstrate and explain the effect of changes in price on quantity demanded
- Movement - a movement along the curve occurs when there is a price change (increase/decrease)
- Expansion in demand = decrease in price
- Contraction in demand = increase in price
- Label points $P_{1,}D_1$ and $P_2,D_2$, etc.
Discuss the non-price factors affecting demand
- Non-Price Factors,
- Tastes and preference (changes in taste and preference towards a product)
- Expectations of consumers - consumers may decrease consumption $\rightarrow$ demand if they are expecting prices to fall
- Price of related - two relationships
- Substitutes - for example, green to red apples - if the price of a substitute good increases, the demand of the good increases (relatively cheaper)
- Complements - if the price of a complementary good increases, the demand of the good decreases as the two products tend to be purchased together - for example, phones and phone cases
- Income (specifically level of disposable income)
- Normal goods - As income increases, demand increases (common sense)
- Inferior goods - goods of lower quality - as income increases, people move towards higher quality substitutes away from the inferior goods, leading to a decrease in demand
- Demographic factors - anything such as age, gender, socioeconomic factors - e.g. an aging population will demand more aged care services
- Acronym is TEPID
Demonstrate and explain the effect of changes in non-price factors on demand
- Shift - the quantity demanded of the good changes at every price due to non-price factors
- Rightward shift = increase in demand
- Leftward shift = decrease in demand
- Label curves $D_{1},D_2,...$, shift is diagonal
- For shifts, you must write at the end at every single price point #testanswer
Supply
Define the Law of Supply
- In most cases, there is a positive relationship between the price of a good and the quantity supplied of that good #testanswer
- At higher prices, suppliers are willing to produce more as it means they can earn more profit
Explain the relationship between individual and market supply schedules and curves
- Market Supply Curve
- The curve obtained from the horizontal summation of individual supply curves
- Individual Supply Curve
- A supply curve relating to an individual producer
Demonstrate and explain the effect of changes (in price?) on quantity supplied
- Price can have either a contractionary or expansionary effect on the supply curve
- This is a movement along the existing supply curve
- Expansions are an increase in price
- Contractions are a decrease in price
Discuss the non-price factors affecting supply
Expectations of Producers
- This is like expected future prices; expected price changes cause suppliers to alter current supply to take advantage of future prices
- Technology
- Improvement in technology can reduce production costs, allowing suppliers to produce more at a lower cost
- Increase in supply is show as a rightward shift of the supply curve
- Prices of other goods
- If the price of a related good increases, the supplier can shift production to increase the quantity supplied of the related good
- Input prices
- Production costs - if the input prices go down, supply can increase
- If input prices go up, supply decreases
- Government Regulation
- Government regulations influence the number of suppliers in the market, which increases or decreases market supply
- Government regulations can take the form of
- Taxes
- Tariffs
- Subsidies
- Quotas
Demonstrate and explain the effect of changes in non-price factors on supply
- This has shift effect on the curve, where quantity produced changes at every price point
- Rightward shifts $\rightarrow$ increase in supply
- Leftward shift $\rightarrow$ decrease in supply
Equilibrium
Outline the concept of market equilibrium
- Equilibrium Price is the price that clears the market, where the quantity demanded equals the quantity supplied
- Changes in the market result in temporary surpluses or shortages which then cause price to change to reach new equilibrium
- Occurs through the price mechanism
- This is the process by which the forces of demand and supply interact to determine the price of a good or service $\rightarrow$ helps to clear shortages and surpluses within the market
- Adam Smith's Invisible Hand theory relates to the unobservable market force that helps the demand and supply of goods in a free market to reach equilibrium automatically
- Enabling people to trade freely
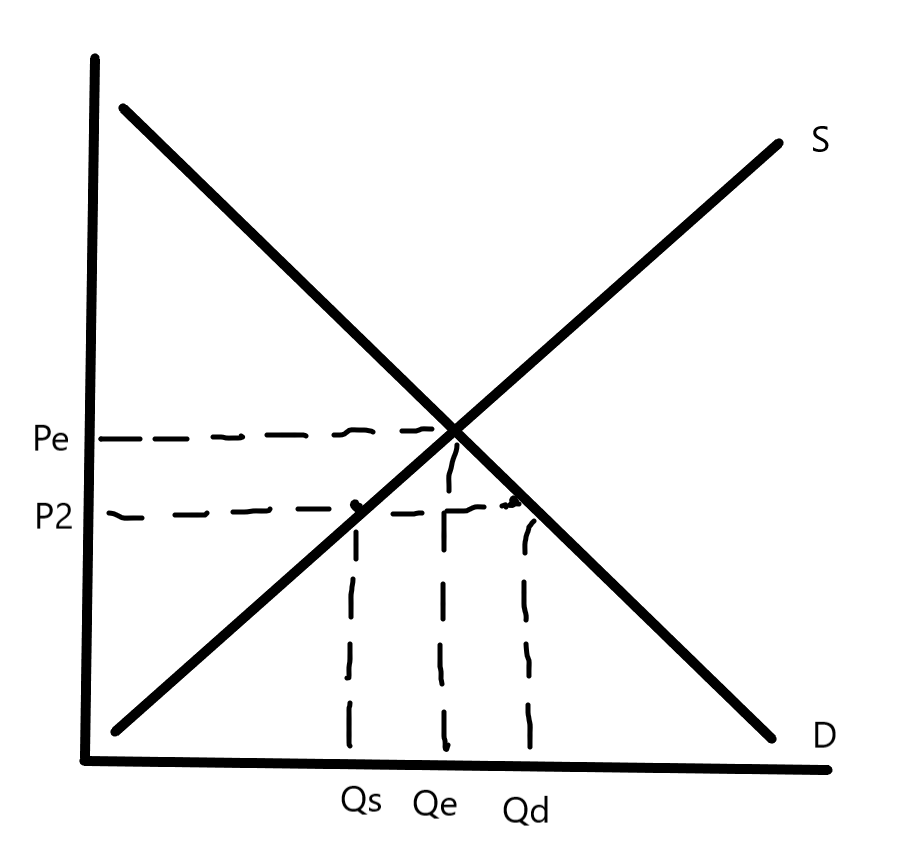
Explain the concepts of market clearing, shortages and surpluses
A shortage is where quantity demanded exceeds the quantity supplied
- Consumers bid among themselves for the limited goods so the price of the good increases
- In the diagram below, we can see that at $P_2$, Quantity supplied is much lower than demanded, so there is a shortage, away from the eqauilibrium of Pe. One thing missing from the diagram: the area of shortage should be indicated
- For this market to clear, for equilibrium to be achieved again, Consumers will bid amongst themselves for the limited supply, increasing the price and leading to a contractionary movement along the demand curve. Because of this, there will be an expansionary movement along the supply curve, achieving market equilibrium again. #testanswer
- On the other hand, surplus is when the quantity supplies exceeds the quantity demanded
- Firms lower their prices to clear excess stock. The same as the above diagram, but the surplus is above the equilibrium
- For this market to clear, Suppliers will lower their prices in order to sell excess stock, leading to a contractionary movement along the supply curve. Due to these lowered prices, there will be increased demand - an expansionary movement along the demand curve. Together, these movements will achieve market equilibrium. #testanswer
- Both surplus and shortages occur because prices are either below or above $P_e$. (below for shortage, above for surplus)
Explain the effects of changes in demand and/or supply on market equilibrium, including simultaneous shifts
- When there is a one-way shift in demand/supply there will be a temporary shortage or temporary surplus
- The market will clear, however
- To explain a one-way shift #testanswer
- Identify the non-price factor
- Does it lead to an increase/decrease - rightward or leftward shift
- At original price, compare quantity demanded and supplied of new curve
- Identify temporary shortage/surplus
- Action taken to clear the market - by the consumers, or the producers
- Expansion/contraction in demand and supply curves
- The new equilibrium, comparing it to the original
- When there is a simultaneous shift, things get a bit goofy.
- One of the values will always be indeterminate.
- For example, Inc. Supply and Dec. Demand: inc. supply will push price down and quantity up, dec. demand will push price down and quantity down.
- Therefore, quantity is indeterminate (it is being stretched up and down!)
- There is a decrease in supply.
- For example, Inc. Supply and Dec. Demand: inc. supply will push price down and quantity up, dec. demand will push price down and quantity down.
- One of the values will always be indeterminate.
Elasticity (PES/D = Price Elasticity of Supply/Demand)
Define the concept, and measurement, of PED
Price elasticity of demand measures the responsiveness of quantity demanded to changes in price #testanswer
- Can be calculated by Percentage Change (Point Method 1) - $$Ed = \frac{%change \space in \space quantity \space demanded}{% change \space in \space price}$$
- Also, the Midpoint Method - $$\frac{(Q_2-Q_1)/[(Q_2+Q_1)/2]}{(P_2-P_1)/[(P_2+P_1)/2]}$$
- Point Method 2 $$\frac{\triangle Q}{Q}\times \frac{P}{\triangle P}$$
Explain the determinants of PED
- There are five main determinants/factors of PED
- The availability of substitutes - if there are substitutes available, a good would be much more elastic
- Whether the good is a necessity or a luxury - necessities would be inelastic, while luxuries would be elastic
- Proportion of income spent - cheaper goods tend to be inelastic and unresponsive to price change, so higher income spent $\rightarrow$ more elastic
- Time period considered - the more time to react to a price change, the more elastic a good gets. For example, for petrol, if the price increases you will likely immediately still need petrol, but in time you could change to other substitutes
- The definition of the market - Narrower categories (fruits $\rightarrow$ bananas) produce more substitutes, and in this example there are many types of fruits. Narrower markets are more responsive.
Distinguish between goods that are price elastic and inelastic in demand
- Two categories
- Price Elastic products are ones where the quantity demanded of the product is relatively responsive to changes in price
- Percentage change in quantity demanded $>$ percentage change in price
- $|Ed|>1$
- These products usually have relatively close substitutes
- To graph, a very steep curve
- Price Inelastic products are ones where the quantity demanded of the product is relatively unresponsive to changes in price
- Percentage change in quantity demanded $<$ percentage change in price
- $|Ed|<1$
- These products cannot be substituted very well usually
- To graph, a very flat curve
- Price Elastic products are ones where the quantity demanded of the product is relatively responsive to changes in price
Special Situations
- $+$ Special Situations
- Perfectly elastic - $Ed=\infty$, i.e changes in price cause an infinity change in quantity demanded
- So, if price changes, quantity demanded falls to zero
- Reflects a perfectly competitive market
- To graph, a full flat curve
- Perfectly inelastic - $Ed = 0$
- Quantity demanded remains the same regardless of price
- Reflects a market where there is fixed demand regardless of price - usually needs such as drugs.
- To graph, a vertical line.
- Unitary Elastic - $Ed = 1$
- Changes in price equal changes in quantity demanded
- Perfectly elastic - $Ed=\infty$, i.e changes in price cause an infinity change in quantity demanded
Demonstrate and describe the link between price elasticity of demand and Total Revenue
- Total Revenue is $P\times Q$
- Graphically, this is the box of $PQ$, with a corner $(0,0)$
- From here, we can calculate gains and losses (difference in boxes)
- Effect of changes in price on total revenue is dependant on the price elasticity of the product;
- For an inelastic good, price has a direct relationship to total revenue (inc. price = inc. total revenue)
- For an elastic good, price has an inverse relationship to total revenue (inc. price = dec. total revenue)
- Unitary goods have a constant total revenue
Tax Revenue & Elasticity
- Depending on elasticity, tax revenue and the burden of tax would vary
- Tax incidence/burden of the tax: Who bears the majority of the tax
- If a good is price inelastic in demand, the amount of tax revenue is higher and the burden of the tax falls more on the consumers
- Relatively small change in quantity demanded
- Think about cigarettes; it is inelastic and people will buy no matter what. The burden then falls on the consumers due to this.
- If a good is price elastic in demand, the amount of tax revenue is lower and the burden of the tax falls more on the producers
- Relatively large change in quantity demanded
Define the concept of PES
- Defined as The responsiveness of quantity supplied to a change in price #testanswer
Distinguish between goods that are price elastic and inelastic in supply
| Elasticity | Elasticity coefficient | Interpretation of Elasticity Coefficient |
|---|---|---|
| Elastic | $E>1$ | Percentage change in QS is greater than the percentage change in price. Relatively close substitutes |
| Inelastic | $E<1$ | Percentage change in QS is lesser than the percentage change in price. Not many close substitutes |
| Unitary | $E=1$ | Percentage change in QS is equal to percentage change in price |
| Perfectly Inelastic | $E=0$ | Percentage change in QS is independant to change in price; it is unresponsive. No substitutes usually. |
| Perfectly Elastic | $Ed=\infty$ | A small change in price will lead to a complete drop in QS or increase. Many close substitutes. |
Explain the determinants of PES
- Time
- Similar to demand; in the short run, goods will be priced inelastic because they won't be responsive.
- In the long run, there is more time for firms to respond to price changes
- Nature of the industry
- What kind of industry it is. A market that produces pencils can easily change production, whereas in a market for agriculture, there is heavy time taken for production.
- Ability to store inventories
- If a business is able to easily store inventories, then it is going to more responsive and elastic in supply
Discuss the application of PED and PES to markets
Analyse the importance of PED and PES for business and government, including tax incidence and Price Discrimination
- Significant to firms
- Monopoly/Market power - setting prices to influence $TR$
- Price Discrimination: To maximise $TR$
- Significant to households
- Can control demand if aware of elasticity and influence on prices
- Significant to Government
- Tax Incidence
- Inelastic - greater incidence on consumers, greater tax revenue
- Elastic - lesser incidence on consumers, lower tax revenue
Market Efficiency
Outline the concept of market efficiency in a perfectly competitive market
- Efficiency means producing the goods that society wants at the lowest possible cost.
- An efficient outcome means that it is not possible to make someone better off without making someone worse off
Explain the concepts of consumer surplus, producer surplus, total surplus and deadweight loss
The consumer surplus ($CS$)
- Consumer Surplus is the difference between what a consumer is prepared to pay and what they actually pay in the market #testanswer
- Marginal Benefit is the extra benefit from consuming one extra unit of the good or service
- The demand curve is what the consumer is actually willing and able to pay
- However, they could actually pay something lower; the difference would be the consumer surplus

The producer surplus ($PS$)
- This is related to the amount the producer is willing to receive.
- Formally, the difference between what a producer is willing to receive and what they actually receive in a market #testanswer
- Marginal cost is the extra opportunity cost of producing one more unit of a good or service
- The same concept as consumer surplus; the difference is producer surplus

- Combining both diagrams, total surplus is the measure of the net benefits to society from the production and consumption of the good #testanswer
- This is equal to the $PS+CS$
- Allocative efficiency is achieved
Outline the efficiency of market equilibrium i.e. maximising total surplus
Discuss how under and overproduction in a market can result in a deadweight loss
Deadweight loss is a loss in total surplus that is avoidable #testanswer
- The situations we have to deal with are where price is above and below the equilibrium
- A diagram for above; it is important to note that $PS$ is not a triangle, but instead the area above the supply curve below P1

- And another, for below

- Also, when quantity is above and below the equilibrium.


Demonstrate and explain the effects of a tax and subsidy on a market
Tax
- Why do governments tax if it introduces inefficiency?
- Can aid in the redistribution of income
- To correct externalities
- To earn revenue
- Impact of tax
- Reduces quantity while increasing price
- Tax incidence depends on the elasticity of the good/service
- Creates a DWL
To explain either,
- Original P/Qty
- Implement government policy
- New price/quantity
- Tax Revenue
- CS/PS/TS/DWL
- Conclusion on efficiency
- Direct tax
- e.g. income tax
- Indirect tax
- Consumers do not pay the tax directly, but are affected through changes in the price of the good or service
- Specific tax: the tax is a fixed amount or is a set sum of money per unit
- Ad Valorem tax: Where the tax is a percentage of the value of the good or service, e.g. GST
- Consumers do not pay the tax directly, but are affected through changes in the price of the good or service
Subsidies
- A payment by the government to a firm to reduce production costs and increase output #testanswer
- The aim is to encourage production of goods with positive externalities
- Allow the producer to export more
- Aid expansion of the firm
- Impact of subsidies
- DWL as part of government expenditure on the subsidy is not translated into either consumer of producer surplus
Demonstrate and explain the effects of a price ceiling and price floor on a market
Price Ceilings
- Price Ceilings are the highest price that a producer can charge on a good
- Is usually below the equilibrium price
- Intended to keep prices affordable for majority of the population
- Need for rationing process to regulate demand, but this could lead to a black market
Price Floors
- Minimum Price that a producer can charge on a good
- Is usually above the equilibrium price
- Designed to ensure that there is a minimum income received by producers
- However, this could result in informal illegal markets where workers are paid less than the minimum wage.
To explain either,
- Original Pe and Qe
- Implement price ceiling or floor
- New price and Quantity
- Compare Qs and Qd $\rightarrow$ shortage/surplus
- CS/PS/TS/DWL
- Talk about changes in CS/PS/TS, then talk about loss in efficiency i.e. DWL.
Market Failure & Power
Define the concept of market failure
- Market failure is the situation defined by the inefficient distribution of goods and services in the free market
Outline the characteristics of an imperfectly competitive market
- A market that is competitive is characterised by
- A relatively large number of firms
- Firms not having Market Power
- Firms not differentiating their products
- No barriers to entry - no licences, blocking of resources, etc.
- However, when these conditions are not met, then the market is considered imperfectly competitive market.
- Synergy, Australia Post
Explain the concept and causes of market power
- A firm has market power if it can affect the market price by varying its output.
- Monopoly and oligopoly firms have lots of market power
- Firms with market power will attempt to maximize profit
- In doing so, their priorities may not align with society's, and thus a socially optimal level of output may not be produced
Explain how market power can influence market efficiency
- A competitive market (with firms not having market power) will produce where demand equals supply
- At the equilibrium, we know $TS$ is maximized, so the market is as efficient as possible
- In the case of market power, quantity will not be at this equilibrium, and thus a deadweight loss is created
- This means that market efficiency is reduced if firms have market power
Discuss the policy options to influence market power, incl. regulation/deregulation and legislation
Regulation
- There is a DWL due to underproduction.
- If there is a natural monopoly, it is not in society's interest to break it up into smaller firms
- This would result in higher firms
- Governments usually regulate natural monopolies to ensure more desirable price and quantity outcomes
- Governments also control who enters the market
Deregulation
- Government regulations that restrict competition include
- Limiting the number of businesses
- Limiting ability to compete
- Reduce the incentives for businesses to compete
- Limiting the choice and information available to consumers
- These can be deregulated to increase competition
Legislation
- Put in place to limit anti-competitive behaviours to achieve a greater degree of allocative efficiency
- ACCC aims to protect, strengthen and supplement the way competition works in Australian markets and industries
- They enforce the competition and consumer act 2010 and other legislation promoting competition and fair trading
Market Failure: Externalities
Explain the concept of externalities, i.e. positive and negative externalities
- Occur when the production or consumption of a good/service cause external costs and/or external benefits
- because Side effects of economic activity to a third party or unintended consequence of economic activity
- Externalities cause market failure if the price mechanism does not take into account the social costs and benefits of production and consumption
Negative Externalities
- Occurs when production and/or consumption creates an external cost
- Causes overconsumption/production - there's always more than what we want being produced
- Market quantity is greater than optimal quantity
- Market price is less than optimal price
- Results in deadweight loss
- Two types: a Negative Production Externality and a Negative Consumption Externality
Negative Production Externality
- Where the marginal social cost of production is higher than the marginal private cost
- Examples include
- air
- land
- noise pollution
Negative Consumption Externality
- Where the marginal social benefit of consumption is lower than the marginal private benefit
- Examples include
- Smoking
- Smoking
- Smoking
- Alcoholism
- Smoking
- Alcoholism
Positive Externalities
- External benefits of consumption or production for third parties
- Causes under consumption or under production
- Results in a DWL
Positive Consumption Externality
- Where the marginal social benefit of consumption is higher than the marginal private benefit
- Examples include
- Flu vaccines
- Education
Positive Production Externality
- Where the marginal social cost of production is lower than the marginal private cost
- Examples include
- Lower transport costs for local firms following construction of new roads
Explain the influence of externalities on market efficiency, i.e. a deadweight loss
Discuss the policy options to correct for externalities, including the use of taxes and subsidies
- Two types
- Regulation/Legislation set by the government
- Market Based Approaches - taxes and subsidies
Regulation/Legislation
Negative Production Externality
- Regulations can forbid the dumping of pollutants to the environment
- Limit the amount of pollutants using a maximum amount
- Limit the quantity of output to producers
- Require technologies (methods of production) to reduce emissions
Negative Consumption Externality
- Prevent consumer activities such as legal restrictions to smoking (public areas)
- Reduce demand towards $MSB$
- Quantity lowered to $Q_o$ and price to $P_o$
Positive Production Externality
- Direct government provision;
- coming out of government funds
- $MPC$ shifts towards $MSC$
- Quantity increases to $Q_o$ and price decreases to $P_o$
Positive Consumption Externality
- Legislation: used to increase consumption e.g. compulsory ages to education
- Advertising: used to increase consumption e.g. public advertisement for education
- Demand increases from MPB to MSB
- Quantity increases to $Q_o$ and price increases to $P_o$
Market Based Approaches
Negative Production Externality
- Imposing a tax on per unit of production or pollutant emission
- Internalise the external cost (recognition)
Negative Consumption Externality
- Impose indirect tax the size of the external cost
- The impact of the tax is passed onto consumers as a higher price they now have to burden
- Quantity drops to $Q_o$ and price increases to $P_c$
Positive Production Externality
- Government can provide subsidies the size of the external benefit (internalise)
- MSC = MPC + subsidy
- Quantity increases to $Q_o$ and price falls to $P_o$
Positive Consumption Externality
- Direct Provision to increase consumption e.g. education and healthcare
- Supply increases the size of government provision
- Quantity falls to $Q_o$ and price to $P_c$
- Subsidies
- Government can provide subsidies to producers to lower the cost and hence lower the price for consumers
- Subsidy used to internalize the external benefit
- Quantity higher at Qo and price lower at pc
Market Failure: Public Goods and Common Resources
Outline the classification of goods
- Two types
- Rival - does the consumption by one party reduce the supply available for another
- Excludable - is it possible to exclude a non-payer from the good or service
- There are Private Goods, Club Goods, Common Property Resources and Public Goods
Private Goods
- Are rival and excludable
- for example, clothing, food.
Club Goods
- Are non-rival and excludable
- Gyms, Concerts
Merit & Demerit Goods
Merit Goods
- Goods that are produced that have large external benefits for society
- Goods that will be underprovided in the economy if the product is left in the market
Demerit Goods
- Goods that are produced that have large external costs for society
- Goods that will be overprovided if left in the market
- Are private goods as they are both rivalry and exclusive
Describe the public goods and the free rider effect
Public Goods
- Non-rival and Non-excludable
- E.g. national parks, lighthouses, national defence
Free rider effect
- Public goods cause the free rider effect
- Free riders enjoy the benefits of the consumption of a resource without paying for the cost of provision
- This can lead to over-consumption and rapid damage of a public resource
Describe common resources and the tragedy of the commons
Common Property Resources
- Are rival and non-excludable
- Fish in the ocean
Tragedy of Commons
- Common Property Resources lead to tragedy of commons
- Refers to the over-consumption of common property resources, e.g. over-fishing
- Occurs as the resource is readily available and there are no restrictions on consumption
- However, once consumed the resource is not available to any other party, leading to depletion of the resource.
Discuss the policy options to reduce market failure associated with public goods and common resources
- Common Property Goods: Enforce restrictions on consumption - e.g. fishing limits, no-fishing zones, fishing licenses, etc.
- Public Goods: Create ownership of the resource, e.g. fees for public transport, fines for damaging public property
Unseen Dot Points
Economics relates to the basic economic problem: limited resources, unlimited wants. Resources are thus relatively scarce, and no matter what there will never be enough.
As a result, choice has to be made between resources, which results in opportunity cost - the value of the next best alternative foregone.
Microeconomics relates to economics on an individual and producer level, which macroeconomics explores economics on a national level.
Economic models are useful in representing a simplified version of reality through the relationship between two variables.
An example of an economic model is the PPF, which demonstrates the aforementioned opportunity cost.
In a market economy,
- there are consumers, producers and goods/services
- there are prices
- there is a price mechanism
- there is private ownership
the law of demand states that there is an inverse relationship between the price of a good and the quantity demanded of that good
- this is due to the income and substitution effect
- income effect: as a product becomes more expensive, it takes up a larger portion of a consumers' income and as such the consumer has less to spend on other goods
- substitution effect: as price increases, consumers will substitute away to lower priced goods
- this is due to the income and substitution effect
individual demand schedules/curves are for one individual only, whereas market is horizontal summation
a change in price will cause a contraction (increase in price) or an expansion (decrease in price) in quantity demanded - this is a moment along the curve
There are various non-price factors that affect demand too;
- Tastes and preferences
- things such as advertising campaigns can impact tastes and preferences towards a good.
- Expectations of consumers
- if consumers expect prices to fall in the future, they will decrease quantity now to take advantage of those expected future prices
- Price of related goods
- Substitutes - these are juggled.
- Complements - whatever happens to a complement will happen to the good as well
- Income
- Normal goods - as income rises, as does demand as consumers can afford to demand more
- Inferior goods - as income rises, demand does not as consumers will switch away as the good is inferior
- Demographic factors
- age, population - all impact demand
- Tastes and preferences
the law of supply states that there is a direct relationship between the price of a good and the quantity supplied of it
- this is due to the fact that, at a higher price, producers will be willing to sell more to earn more
horizontal summation yet again.
non-price factors affecting supply include
- expected future prices - if they expect future prices to increase, they will decrease supply now
- input prices - higher input prices = less supply
- technology - better tech = more supply
- government regulation - reg up or down
- price of related goods - if the price of a related good increases, they can shift supply to that one, decreasing for the current one, to take advantage
market equilibrium is where qs = qd
if qs not equal to qd, usually during shifts, then there will be a surplus or a shortage
- to correct for this, producers can lower prices to sell excess stock or consumers can bid up the price, both result in the market clearing
for single changes its fine;
- for simultaneous. in the extract we will know the magnitude of one is greater than the other, so the effect of that one will be greater and whatever that relates to will not be indeterminate.
price elasticity of demand relates to the responsiveness of quantity demanded to a change in price
- it is measured using the elasticity coefficient, Ed = %change in q/%change in price
the determinants of PED are
- the availability of substitutes
- if there are more substitutes available to switch to, the good will be relatively elastic
- time period considered
- the more time to react the more elastic
- proportion of income spent
- if it spends more income its more elastic
- definition of the market
- broader markets will be more elastic
- whether the good is a necessity or a luxury
- necessities are inelastic and luxuries are elastic
- the availability of substitutes
distinguishing
- price elastic: ed > 1, consumers are relatively responsive to changes in price, curve is therefore more flat
- price inelastic: ed < 1, curve is steep
- unitary - 1, normal curve
- perfectly are easy
TR = PQ
- inelastic - an increase in price will lead to a less than proportionate decrease in quantity, therefore TR increases
- elastic - an increase in price will lead to a more than proportionate decrease in quantity, therefore TR decreases
PES is the responsiveness of quantity supplied to a change in price
price elastic - steeper curve, Es > 1
price inelastic - flatter curve, Es < 1
unitary Es = 1
perfectly again
determinants
- time period considered - the more time they have to react the better
- ability to store inventories - pencils vs tractors
- nature of the industry - agri is more inelastic
tax is interesting
- on an inelastic good, the burden of tax falls more on the consumers